Navigating Food Insecurity in Urban Canada
Findings from an exploration of five household archetypes
Since its inception in 2016, The Centre has worked to better understand the causes of and pathways out of food insecurity for Canadian households. Following research we funded by Statistics Canada to better understand the relationship between income and food insecurity, and a growing understanding of the disproportionate impact of food insecurity amongst people with disabilities, we wanted to explore how we could have greater impact through our funding, partnerships and advocacy.
What is an archetype?
Archetypes refer to patterns of behaviour and common experiences that tie together groups of people.
We believe the experience of food insecurity is not universal, and therefore the programs and policies we design as a food security sector need to respond to those diverse experiences. We wanted to take a deeper dive into the lived experience of population groups in urban settings, to increase our own understanding, as well as those working in community groups and government. With our partner October Systems, we spoke to people experiencing food insecurity in urban centres across Canada to understand what led to their experiences and what challenges they have faced navigating access to supports.
The findings from this work cover both broad insights about the experience of food insecurity, as well as specific insights – detailing the root causes of food insecurity, the barriers and frictions people face in accessing support, and critical moments to design for in addressing food insecurity.
The five archetypes and how we chose them
To determine which population groups we would focus on, we looked at demographic data regarding food insecurity, spoke with 20 experts about emerging trends that may not be captured by population-level data, and held a prioritization workshop with nine experts in the field. This process led us to narrow down to five archetypes:
| Who? | Why? |
|---|---|
| Immigrants with permanent resident (PR) status | Historically, immigrants move out of food insecurity over time, but emerging research suggests this may not be the case for a growing group. By focusing on those with PR status, we aimed to understand what was preventing ‘settled’ immigrants with a variety of tenures (from recent arrival to 20+years) from achieving food security. |
| Families including a person with a disability | Disability impacts on both sides of the income/expense ledger and can prevent families from achieving financial stability while also triggering specialized food and care needs. This group includes families where one or more adults have a disability and families caring for a child with a disability. |
| Single mothers | Single mothers experience a greater likelihood of food insecurity, due to the challenges of supporting a household on a single, often lower, income. |
| Single adults living with a disability | Single adults living with a disability experience food insecurity at high rates and face a range of accessibility challenges related to employment, housing, transportation, and care. |
| Couples with kids, with a household income over $60k | Families with annual household incomes above $60,000 aren’t typically on the radar for food insecurity and sit above the threshold for most benefits and supports, such as the GST/HST credit. However, this group is experiencing growing rates of food insecurity. |
For each of the five archetypes, we have created descriptions of their specific challenges and opportunities, an exemplar story connected to the people we interviewed, and a visual representation of their experience over time.
In the coming weeks we will share more details about what we learned from each of the archetype groups.
Housing, debt & employment are cross-cutting factors across all archetypes
Housing costs and precarity are nearly universal core expense drivers in stories of food insecurity whether an unplanned move, a repair, or a mortgage renewal.
Debt was a common thread in the stories of food insecurity. Desperation, financial management knowledge, and access came together to shape attitudes and outcomes connected to debt and household cashflow.
Employment stability and income potential drive to the heart of the income side of the household financial ledger.
These three factors, while showing up in diverse ways, contributed to households and individuals using food expenses as a “smoothing” factor to get by a financially pinched period before returning to “normal”.
Three income and expense dynamics help explain food insecurity journeys
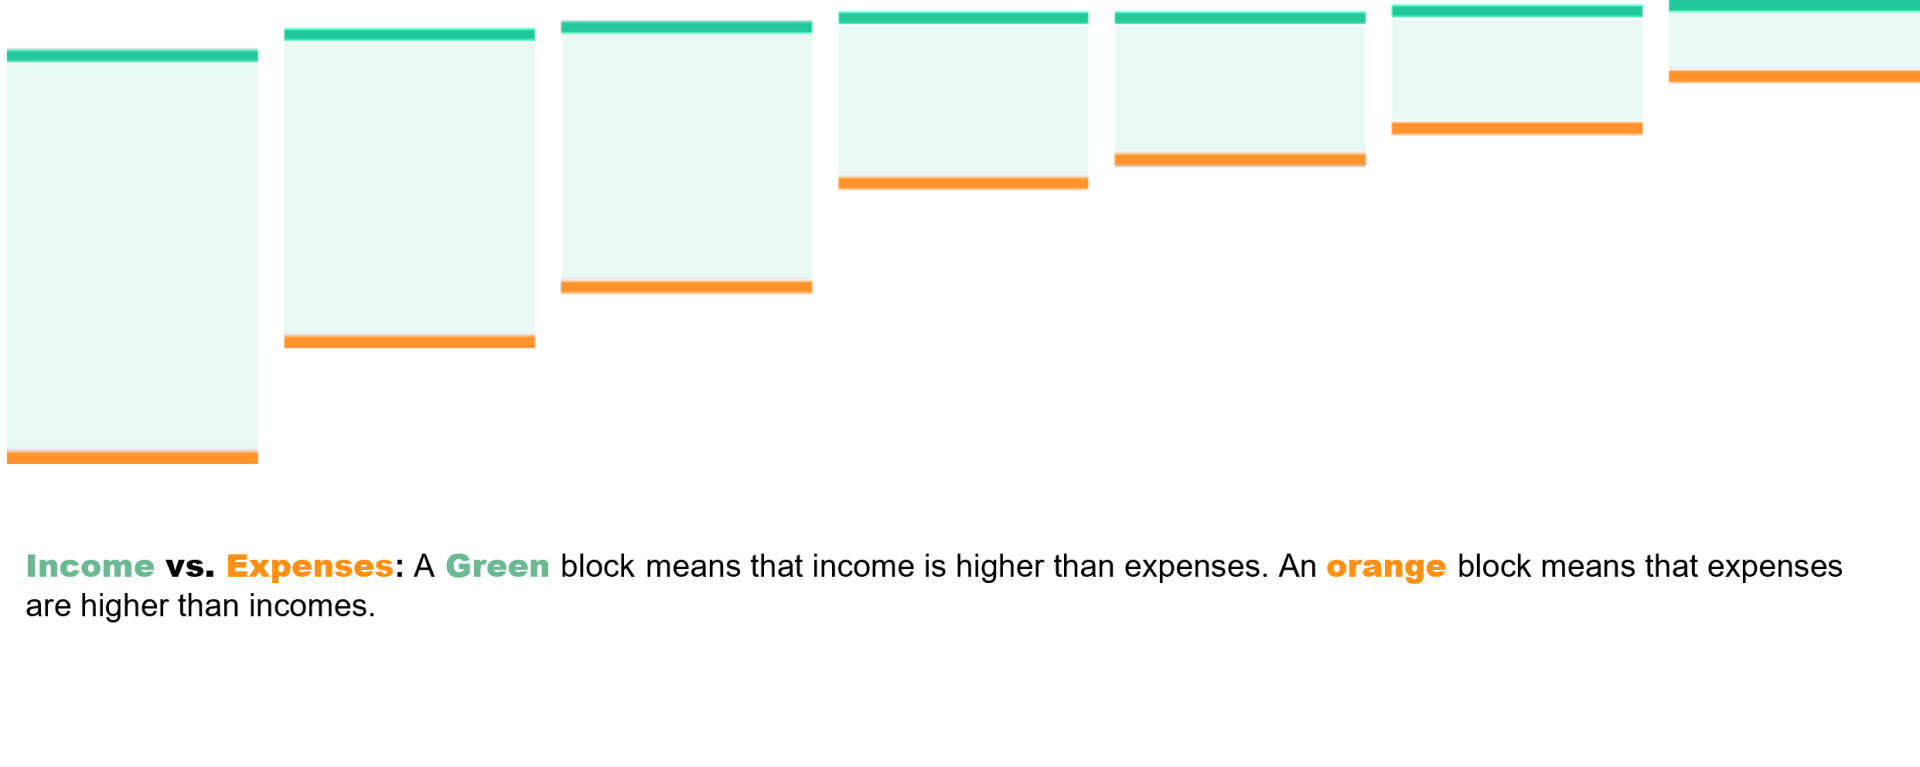
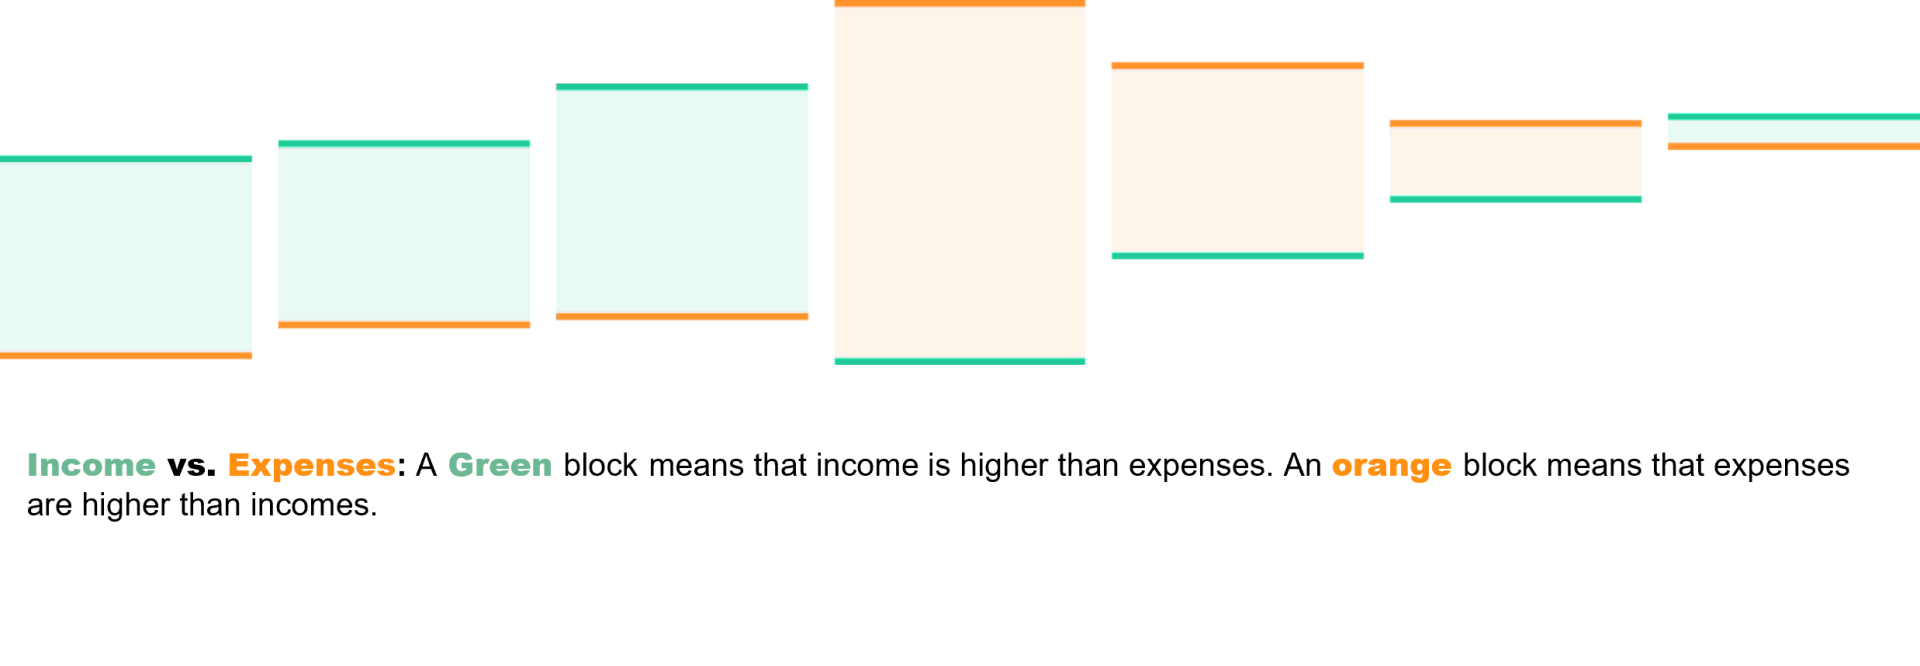
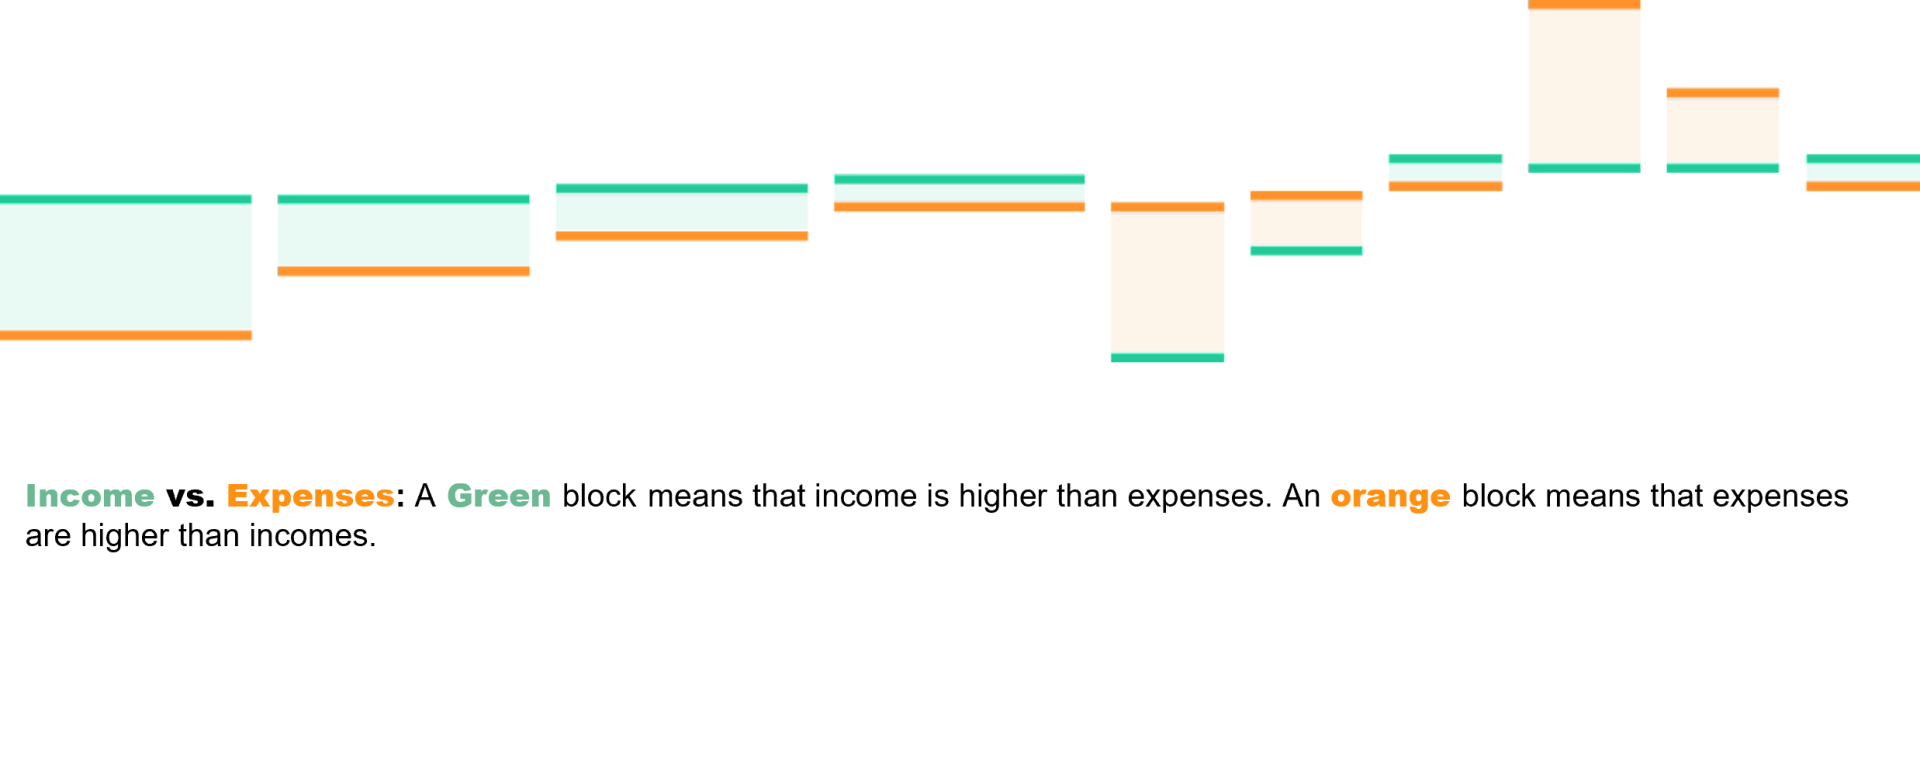
Participants’ individual journeys were highly specific and unique, given that their experiences of food insecurity were embedded in a web of financial opportunity, obligation, and risk. However, the core dynamics of “income and expense” surfaced three key household finance patterns – each of which show up in diverse, archetype-specific ways. These patterns are a helpful way to understand individual food insecurity journeys:
Creep: An inexorably narrowing margin between income and expenses, even when you’re doing everything right. In this pattern, people who have, on paper, checked many of the boxes required for stability and attainment experience a gradual shrinking of the distance between their incomes and their expenses. Initially, this shrinking may be attributed to short-term deliberate pinches like a new home or child. But over time, that margin gets smaller and smaller, exposing them to significant shock risk.

Common Archetype Alignment: Immigrants with Permanent Residency; Families caring for a person with a disability; and Couples with kids, with a household income over $60k
Catastrophe: A sudden spike in expenses, drop in income, or both at the same time disrupts even the best laid plans. In this pattern, people experiencing one or more significant events that impact their income (e.g. a job loss or partner separation), their expenses (e.g. a mortgage renewal or arrival of a new baby), or in the worst cases, both at the same time (e.g. a disabling event that requires significant care or refit in terms of housing, transportation etc.). Financial recovery can be slow, and exacerbated by temporary, emergency measures like high-interest debt.

Common Archetype Alignment: Immigrants with Permanent Residency; Families caring for a person with a disability; Single moms; Single people living with a disability; Couples with kids, with a household income over $60k
Caught: Ongoing loops of income disruption, expense spikes, bureaucratic wrangling, and general life turbulence make it nearly impossible to stay afloat. In this pattern, people wind up stuck in continuous loops of small gains eroded by large and small losses. On the gains side of the ledger, these individuals may be seeking to get full-time work, apply for benefits, and gather help from family. On the losses side, they’re seeing hours cut, wrangling bureaucracy, taking time off to manage their health or the health of their families, or facing spikes in rent or utility bills. The net result is that it’s taking everything they have just to stay above water.

Common Archetype Alignment: Families caring for a person with a disability; Single moms; Single people living with a disability
What’s next
In the coming weeks we will share more through our blog about what we’ve learned for each of the five archetypes:
- Sasha & Oleg – parents caring for a child with a disability
- Curtis – single and living with an acquired disability
- Keira – a single mom with an uncooperative ex
- Baljeet – a newcomer experiencing economic precarity
- Natalie & Ahmed – doing “all the right things” and still struggling to make ends meet
A summary report of what we learned was used in a workshop with 30+ representatives from government, corporations, and community-based organizations to generate new ideas on how we can address food insecurity.
The interviews and workshops helped to identify emerging ideas around the types of services, programs, policies and supports that may be helpful. The Centre will use these results to further clarify our strategies to reduce food insecurity in Canada – through granting, collaboration, and advocacy. These include traditional approaches (e.g. policy-based interventions, food programs) and more emergent, “outside the box” ideas that provide starting points for further exploration.
We will continue to update our partners and stakeholders as we move forward.
The summary report from the workshop is available on our website. If you’d like to discuss this report or receive a copy of the full research report, please fill out our request form or email info@feedopportunity.com.
December 16, 2024